For the final project in my Mechanics of Solids and Structures course, my partner and I performed a study on the varying strength of 3D print infill. We aimed to investigate the strength of different infill patterns and percentages for 3D printed parts using FEA (finite element analysis). This process involved creating SOLIDWORKS models of a part with each of our selected infill types. The study also entailed creating a SOLIDWORKS material with custom material properties. 3D-printed PLA is an orthotropic material, meaning it has different properties in different directions so we performed Instron tension tests to determine the material properties necessary to conduct the FEA.
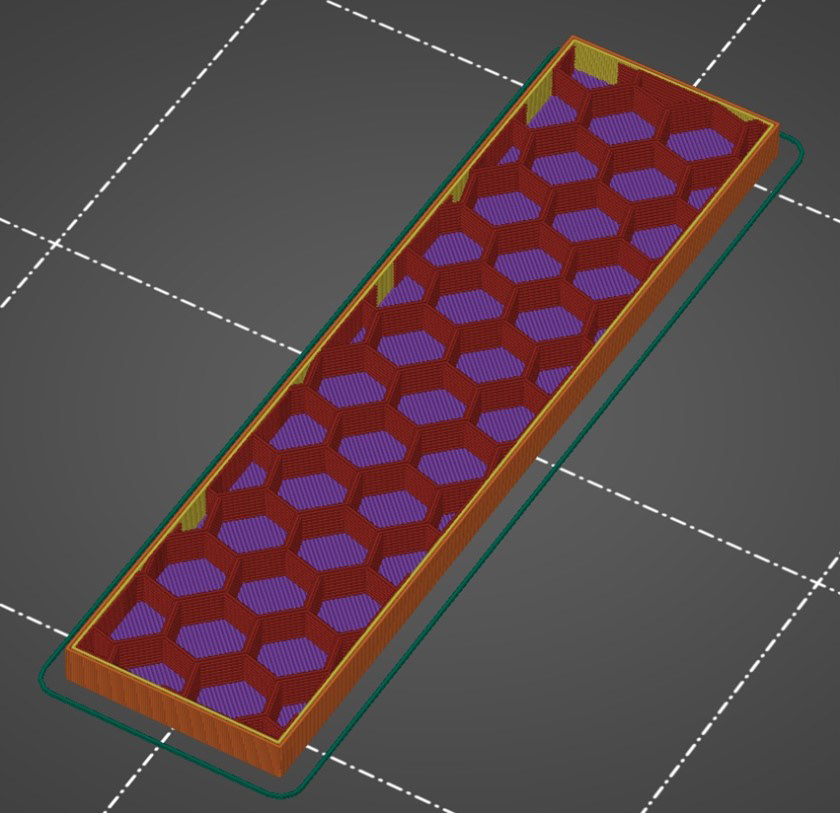
To create the test models, we put a simple rectangular prism into a slicer software and added the infill (shown on the left). From this, we were able to take measurements off of the infill placements and replicate them in CAD (shown on the right).
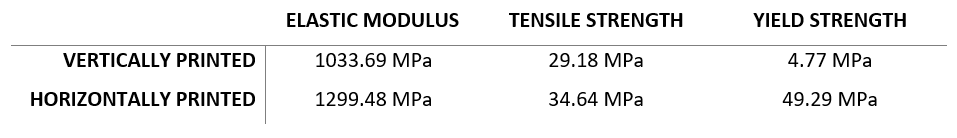
To gather the material properties necessary to conduct FEA, we performed a tension test using an Instron machine. We tested both vertically and horizontally printed PLA parts. This allowed us to understand the difference in strength when pulling perpendicular vs parallel to the print layers.
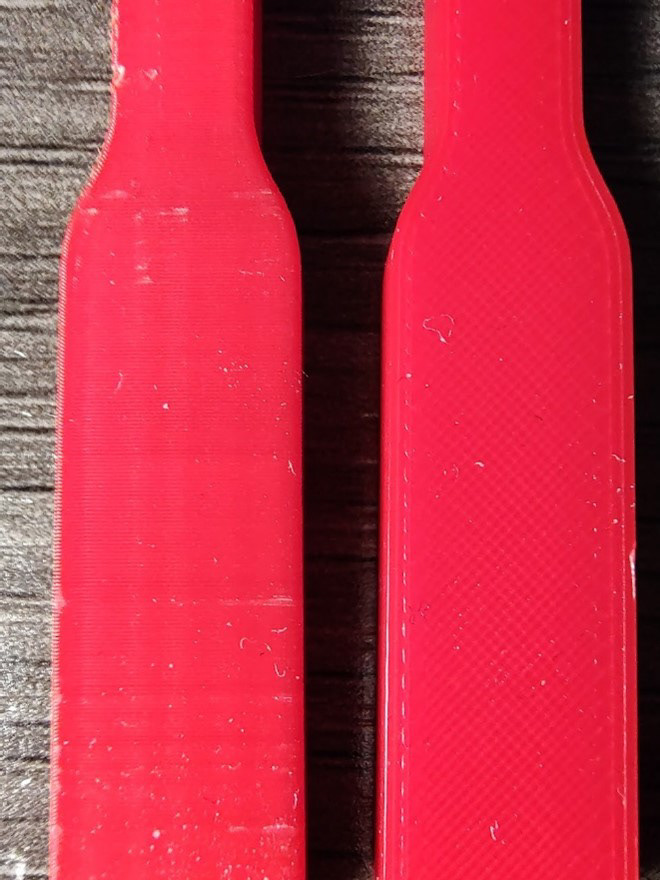
Comparison of vertical (left) vs. horizontal (right) 3D print texture.
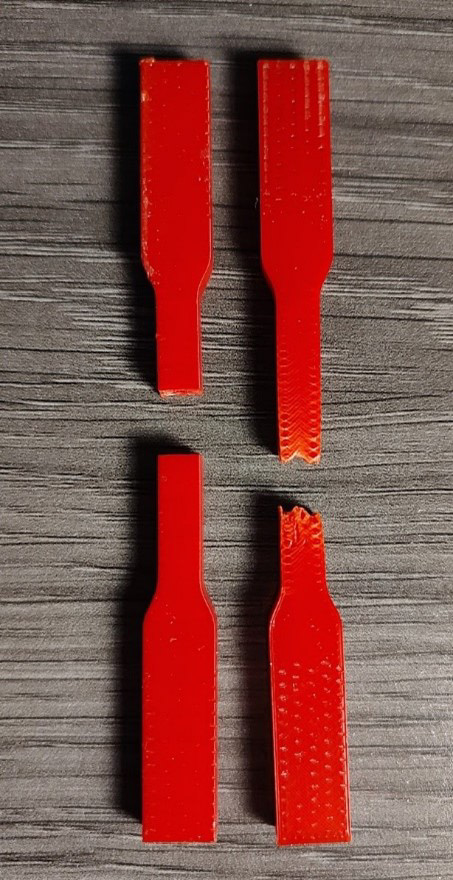
Dog bones before and after fracturing in the tension test (vertical left and horizontal right).
Through the tension test, we were able to gather the material properties shown below. As expected the print was far weaker in the vertical direction.
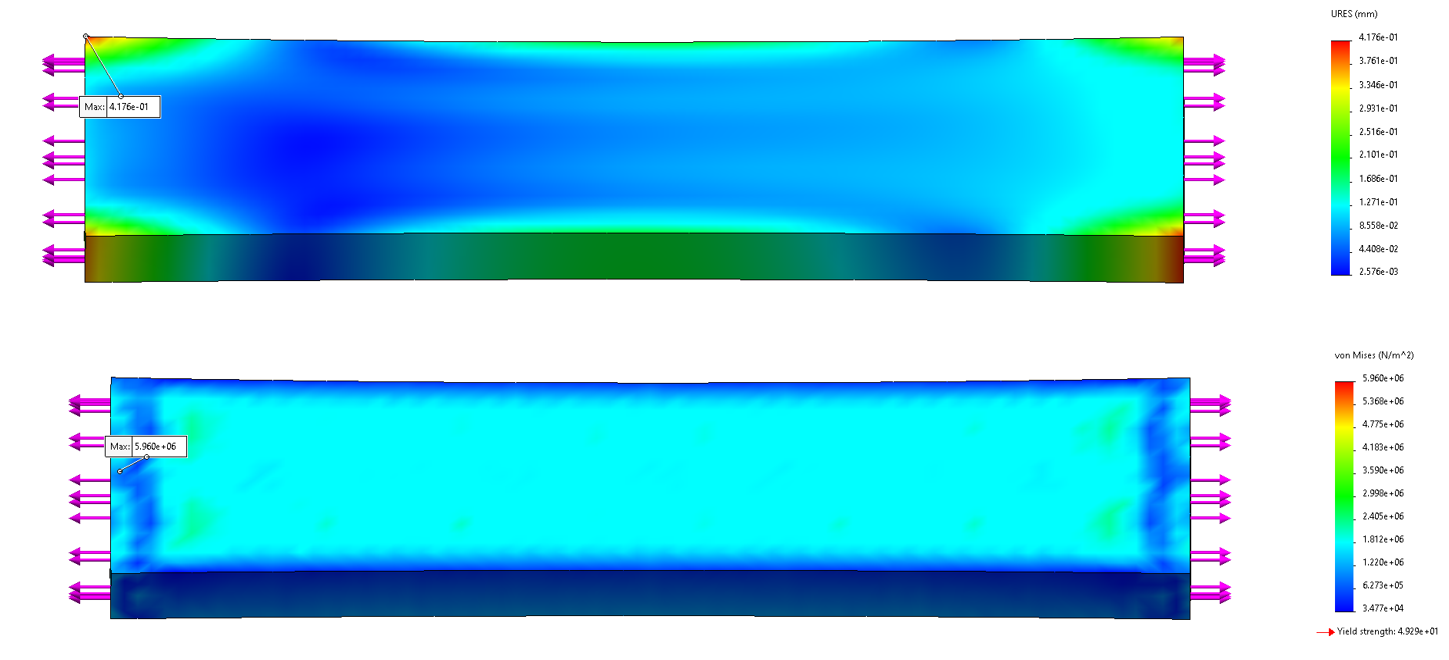
In order to conduct a simulation of our pieces under load, we first applied the material to each of them. Then for each part, we applied a pulling force of 100N to both ends. From here we collected the values for the total deformation and maximum stress. Below are the results and images of the grid, 10% stress and strain plots.
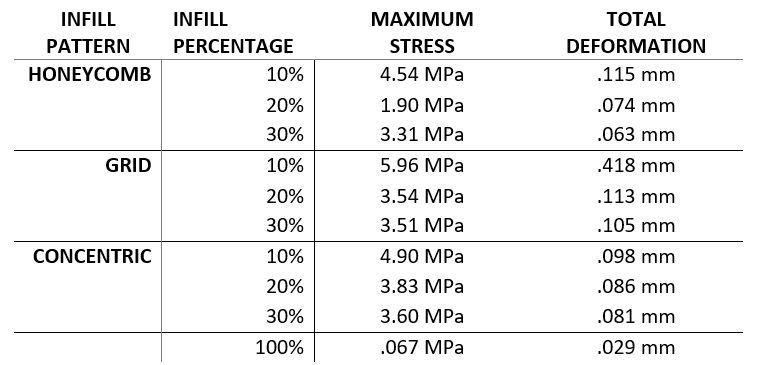
Through the FEA, we were able to produce the results shown above. From them, it is clear that the grid infill pattern is the weakest and honeycomb is the strongest. However, it is by a small margin and the general stresses and extensions of the test pieces are relatively similar between test patterns. So, although there are clear benefits to the honeycomb infill pattern, the use of the other two would likely not yield a notable difference for most applications. The increase in strength between 10% and 20% infill is far larger than the increase between 20% and 30%. This implies that there are diminishing returns when increasing the infill percentage. Despite this, 100% infill still produces notably improved results and is far stronger.
One notable inconsistency is that the 20% infill of honeycomb experiences a lesser load than the 30%. It is possible this is due to an error in the creation of our model or the setup of the FEA, however, no such error was found. As such, it may simply be that the arrangement of the geometry simply happens to create less opportunity for a peak load to appear. This seems reasonable as the overall displacement still follows the expected trend and is lower than 30%.